PreviousNext
Images for page 1590
Previous/Next Page
Federation and MeteorologyBureau of Meteorology
----------
Table of Contents

Antarctic Operational Meteorology

Abstract

Introduction

The Past

The Present

The Future

Acknowledgements

References


Index
Search
Help

Contact us
Figure 17 Numerical MSL forecasts for the Southern Hemisphere for 24, 48, 72 and 96 hours based on the numerical MSL analysis for 1200 UTC on 28 Jan 1997 shown in Figure 8 (source National Meteorological Centre Melbourne).

  Numerical MSL forecasts

[Return to Text]

Figure 18 Time variation in global forecast skill as measured by the S1 skill score (This score essentially provides a measure of the degree of error in the depiction of a forecast pressure field; the lower the score the better the forecast). The upper panel indicates the performance of the Australian operational forecast model against an independent analysis (METANAL); recent models produce their own analysis and can be compared against these (SELF).
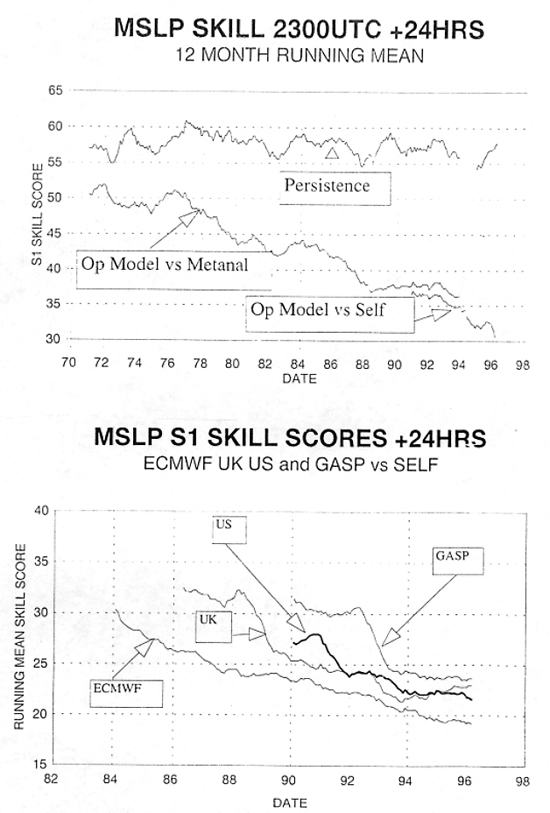
The lower panel compares the Australian (GASP) model against those of the equivalent analysis centres, the National Meteorological Centre Washington (US), the British Meteorological Office, Bracknell (UK) and the European Centre for Medium Range Weather Forecasts, Reading UK (ECMWF) (source—Bureau of Meteorology National Meteorological Centre).

  Time variation in global forecast skill

[Return to Text]


Previous Page Bureau of Meteorology Next Page


© Online Edition Australian Science and Technology Heritage Centre and Bureau of Meteorology 2001
Published by Australian Science and Technology Heritage Centre, using the Web Academic Resource Publisher
http://www.austehc.unimelb.edu.au/fam/1590_image.html