PreviousNext
Images for page 1607
Previous/Next Page
Federation and MeteorologyBureau of Meteorology
----------
Table of Contents

Australian Meteorology through the 20th Century

Introduction

The Origins of Australian Meteorology

Meteorology in the 20th Century

The Weather and Climate of the Twentieth Century
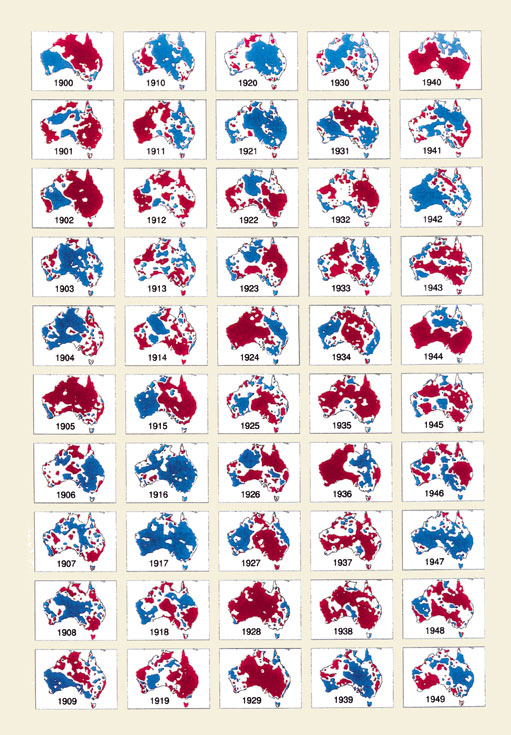
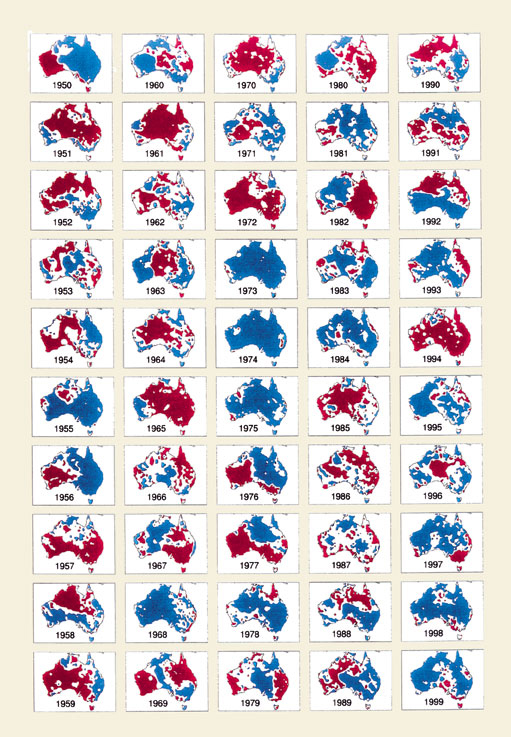
Rainfall
Temperature
Tropical Cyclones
Floods
Droughts
Bushfires
Severe Storms

The Great Weather and Climate Events of the Twentieth Century

A Century of Progress in Science and Service

References

Australian Meteorological Milestones of the 20th Century

Endnotes

Index
Search
Help

Contact us
Figure 6 Annual values of the Southern Oscillation Index (SOI), a measure of fluctuations in the surface pressure difference between Tahiti and Darwin and a useful indicator of the broadscale controls on Australian weather.

  Annual values of SOI

[Return to Text]

Figure 7 Averaged annual mean rainfall (mm) over Australia, 1900–. The solid line shows the eleven-yaer running mean.

  Averaged annual mean rainfall

[Return to Text]

Figure 8 The spatial pattern of trends in annual mean rainfall over Australia 1900–99 in mm per century. Green areas have become wetter and brown areas drier.

  Annual mean rainfall

[Return to Text]

Figure 9 These maps show the distribution of annual rainfall over Australia during the twentieth century. Above normal (third tercile) is shown as blue, near normal (second tercile) as white and below normal (first tercile) as red.

  1900-1949

[Return to Text]

  1950-1999

[Return to Text]


Previous Page Bureau of Meteorology Next Page


© Online Edition Australian Science and Technology Heritage Centre and Bureau of Meteorology 2001
Published by Australian Science and Technology Heritage Centre, using the Web Academic Resource Publisher
http://www.austehc.unimelb.edu.au/fam/1607_image.html