Table of Contents
Antarctic Operational Meteorology
Abstract
Introduction
The Past
The Present
The Future
Acknowledgements
References
Index
Search
Help
Contact us

|
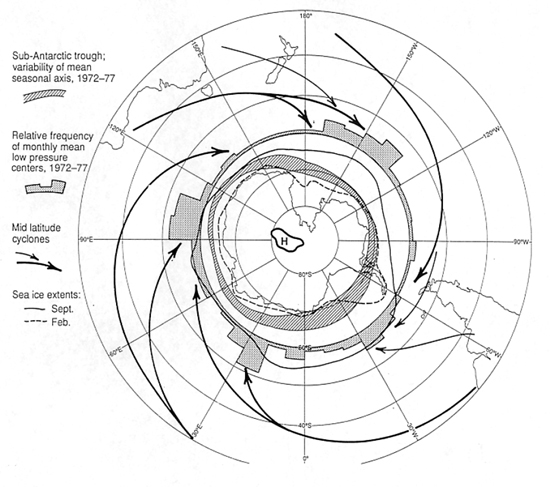
Figure 7 Schematic (after Carleton 1992) ummarising dominant features of the synoptic climatology of higher southern latitudes compiled from various sources. These are Streten 1980 (b), variability of the mean seasonal axis of the sub-Antarctic circumpolar trough for the years 1972–1977, mean location of the continental "high" (1972–1977), relative frequency by longitude of monthly mean low pressure centres in the sub-Antarctic trough (1972–77); Astapenko (1964), Taljaard (1972), Streten and Troup (1973), Carleton (1979), Mayes (1985 major: bold and secondary: thin tracks of mid latitude cyclones; Jacks (1983) maximum and minimum sea ice extents).
[Return to Text]
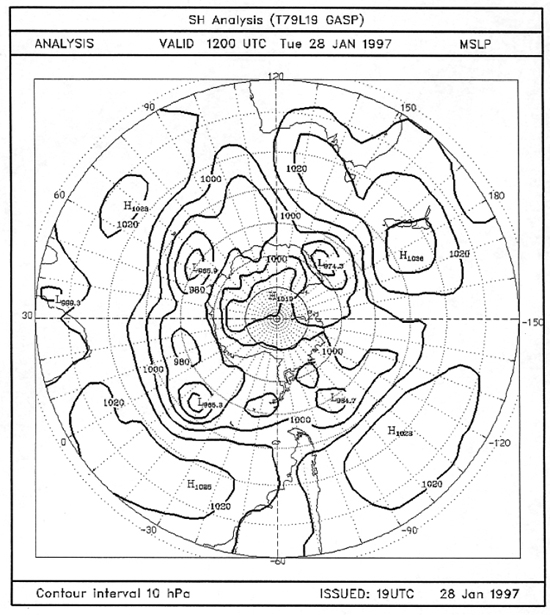
Figure 8 Numerical MSL analysis for the Southern Hemisphere for 1200 UTC 28 January 1997 (source National Meteorological Centre—Melbourne).
[Return to Text]
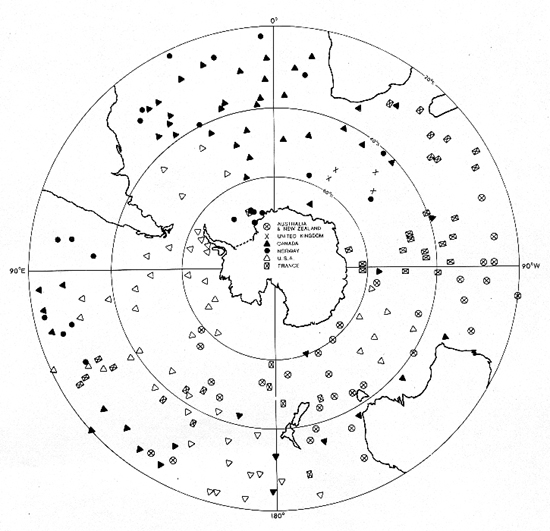
Figure 9 Location and origin of buoys reporting surface pressure over the Southern Ocean during a typical day of FGGE (first GARP Global Experiment— June 1979). (after Streten and Pike 1980).
[Return to Text]
© Online Edition Australian Science and Technology Heritage Centre and Bureau of Meteorology 2001
Published by Australian Science and Technology Heritage Centre, using the Web Academic Resource Publisher
http://www.austehc.unimelb.edu.au/fam/1588_image.html
|


