


Antarctic Operational Meteorology
Abstract
Introduction
The Past
The Present
The Future
Acknowledgements
References
Index
Search
Help
Contact us
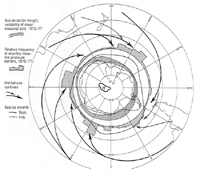
A schematic representation of some of these data is shown in Figure 7 (Carleton 1992).
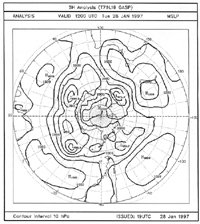
Hand in hand with the development of satellite technology went the evolution of numerical modelling. Meteorology unlike eg. geological or biological sciences does not often substantially advance through particular individual observations in the field (though the discovery of the ozone hole over Antarctica by British Antarctic Survey scientists in 1985 provides a notable exception to this statement). In general, however, advances in broadscale meteorology result from detailed regular observations of the well known physical parameters of pressure, temperature, moisture and windspeed and direction over a widespread geographical area and through the depth of the atmosphere and by attempting to determine the interactions between them on various time and space scales using established physical laws. These laws expressed as a series of equations constitute a numerical model of the atmosphere with data applicable to them on a four dimensional basis (time being the fourth dimension). The solution of these equations at various time and space scales is the principal end product of operational meteorology and provides the basis for modern analysis and prognosis of the various atmospheric variables and hence of weather and climate. Such a process can only be satisfactorily achieved by calculation of the physical fields using increasingly powerful computers. It is to these computers (as well as to the expansion of observational techniques) that the remarkable improvement in short term weather forecasting which has occurred over the past 25 years is largely due. The earliest operational Southern Hemisphere numerical analysis and prognosis system dates from the work in the (then) Commonwealth Meteorology Research Centre (Gauntlett and Hincksman 1971, Gauntlett et al. 1972). Successive models have been introduced over recent decades see eg. Bourke (1974), Bourke et al. (1995) and Seaman et al. (1995) with improvements in computing power and in the methods of inclusion of the physics to describe within the model the small scale processes occurring in the atmosphere. Numerical models now operate at global scales and require the input of data from the entire earth. Figure 8 provides an example of a typical recent Southern Hemisphere segment of a global MSL analysis.
A notable step in global meteorological analysis and forecasting occurred in 1978–79 when the value of the introduction of the new computational methods and models and the availability of the latest observation systems based on satellites and drifting buoys reporting by satellite was tested by a new experiment founded on the work of the IGY. This was known as the First GARP (Global Atmospheric Research Program) Global Experiment or FGGE. Special observing periods were set up to obtain the best data available to use as the basis of trial global analysis and prognosis by the various numerical models then in use.
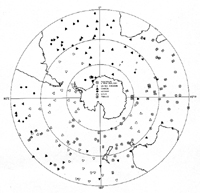
The results of this experiment particularly in the Southern Hemisphere (see for example Guymer and Le Marshall (1980), Leslie et al. (1981), Bourke et al. (1982) provided confidence in continuing with the operational development of the technologies trialed during FGGE eg. development of free-drifting buoys (Figure 9) and Automatic Weather Stations (AWS) has continued though perhaps not at the level which would ensure a high quality of data coverage particularly at high southern latitudes within the sea ice zone. The FGGE work led also to an improved climatology of the Southern Hemisphere (for example see Le Marshall et al. 1985).
Thus, FGGE as with the IGY was to provide a catalyst and impulse to global observing and numerical analysis and prediction. In this sense FGGE was a direct descendent of the IGY as the IGY was of the early International Polar Years and all these successive experiments have set new directions for global geophysics, and in particular for meteorology. They have emphasised that the study of the atmosphere has become a global one so that observations must come from all parts of the globe and be analysed on a global basis. Thus, those who sought meteorological observations by ANARE at Macquarie and Heard Islands in the 1940's and from Antarctica in the 1950's in the belief that this would improve forecasts for Australia were correct but this was only part of a wider global picture and one in which Australia's efforts through ANARE provided an early vision and continue to play a significant role.
Organisations in Australian Science at Work - Commonwealth Meteorology Research Centre
 |
Bureau of Meteorology |  |
© Online Edition Australian Science and Technology Heritage Centre and Bureau of Meteorology 2001
Published by Australian Science and Technology Heritage Centre, using the Web Academic Resource Publisher
http://www.austehc.unimelb.edu.au/fam/1588.html