


Antarctic Operational Meteorology
Abstract
Introduction
The Past
The Present
The Future
Acknowledgements
References
Index
Search
Help
Contact us
Probably the most significant developments for the observation and understanding of the weather systems of the Southern Ocean and Antarctica came in the late 1960's with the first appearance of the data stream from the polar orbiting satellites and the commencement of operational numerical analysis using the newly available and relatively powerful electronic computers.
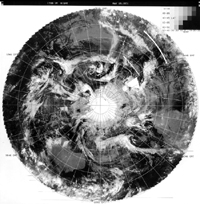
In their initial stage of development the US polar orbiting satellites (the TIROS and NOAA series) provided cloud imagery which brought to life the conceptual views of broadscale weather patterns developed over past decades by synoptic meteorologists; in particular, for the first time the great depressions and frontal systems of the Southern Ocean were revealed to the human eye. Compositing and processing of the imagery led, by about 1966, to hemispheric pictures based on a series of swathes derived from successive satellite passes as the earth turned beneath the satellite orbit. Thus, sequences of pictures such as is shown in Figure 5 were available to study the evolution of weather systems across the broad expanse of the Southern Ocean and enabled the weather events on the Antarctic coast to be seen in the context of what was happening over the lower latitude continents. Such pictures were examined in relation to the conventional surface and upper air observations particularly those from the IGY network which had been largely continued after the end of the experiment period. Thus, for example frontal passage events over the Southern Ocean at such locations as Macquarie Is could be better examined (for example see Zillman and Martin, 1968) and the characteristics of the life cycle of major Southern Ocean depressions and their effects on both Antarctica and the lower latitude continents could be followed.
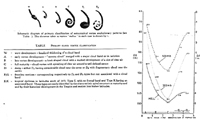
The new data allowed the construction of hemispheric weather charts with much more confidence than previously. Even though the absolute values of surface and upper air parameters were (and are) often not known precisely they could often be inferred to some degree of accuracy by anomalies from mean surface pressure and "thickness" (ie. the difference in height between various standard pressure levels in the upper atmosphere, say 1000 to 500 hPa) in relation to the relevant local cloud patterns (Streten and Troup 1973, Guymer 1978—see Figure 6).
In this way more reliable sequences of meteorological analyses could be produced and some broad climatological features established. Among the latter were:
- the pattern of birth, growth and decay of depressions forming primarily at middle latitudes and moving on generally poleward and eastward paths with corresponding anomalies from the mean pressure values (Carleton 1979, 1981, Jones and Simmonds 1993).
- seasonal latitudinal movement of the axis of low pressure surrounding Antarctica—the Antarctic Trough" (Streten 1980b).
- the broadscale extent and general characteristics of the sea ice zone surrounding Antarctica and indications of ways in which it was affected by (and perhaps affected) the polar atmosphere (Streten and Pike 1980), Jacka 1983, Carleton 1989, Simmonds and Wu 1993.
- the evolution of mesoscale depressions (Polar Lows) at high latitudes which sometimes affect the Antarctic coast and which have more recently been the subject of detailed study (Turner and Thomas 1994).
People in Bright Sparcs - Streten, Neil Anthony
 |
Bureau of Meteorology |  |
© Online Edition Australian Science and Technology Heritage Centre and Bureau of Meteorology 2001
Published by Australian Science and Technology Heritage Centre, using the Web Academic Resource Publisher
http://www.austehc.unimelb.edu.au/fam/1587.html