Table of Contents
Antarctic Operational Meteorology
Abstract
Introduction
The Past
The Present
The Future
Acknowledgements
References
Index
Search
Help
Contact us

|
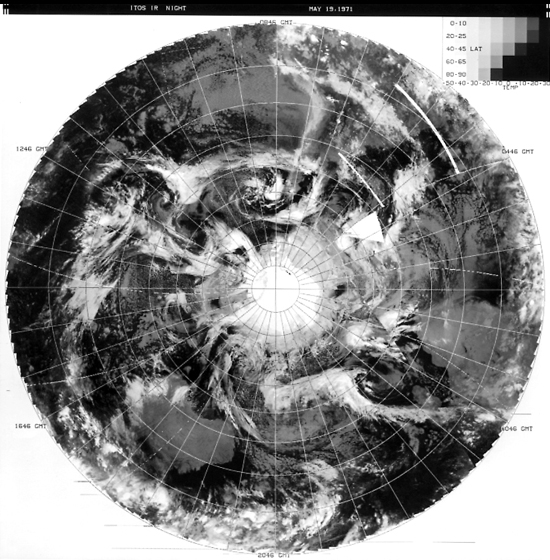
Figure 5 Night time infra red image of the Southern Hemisphere for May 19 1971 based on composite satellite passes from the United States ITOS satellite— Note that in this imagery the colder continents and high cloud features appear in lighter shades while the warmer seas appear dark—an approximate temperature scale appears to the top right (source—NOAA).
[Return to Text]
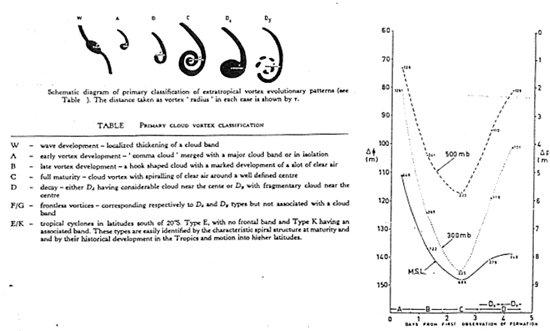
Figure 6 A satellite cloud vortex model. To the left are shown schematic diagrams of the stages in the evolutionary lifecycle of a typical Southern Hemisphere extratropical cloud vortex and a descriptive table; to the right the diagram shows mean anomalies of surface pressure (millibars) and upper level gropotential (metres) associated with each evolutionary stage (after Streten and Troup 1973).
[Return to Text]
© Online Edition Australian Science and Technology Heritage Centre and Bureau of Meteorology 2001
Published by Australian Science and Technology Heritage Centre, using the Web Academic Resource Publisher
http://www.austehc.unimelb.edu.au/fam/1587_image.html
|


