


Antarctic Operational Meteorology
Abstract
Introduction
The Past
The Present
The Future
Acknowledgements
References
Index
Search
Help
Contact us
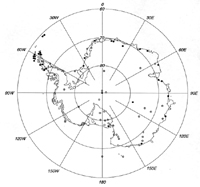
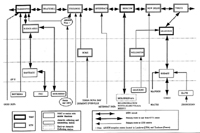
The current meteorological observing system for Antarctica consists of essentially two components—that based on the observations from satellite-borne sensors and that based on observations made at the Earth's surface. Thus, the former system looks down at the earth's surface through the atmosphere and derives information about both the surface and the atmosphere and the latter examines the local surface environment through conventional measurements but also continues to use radiosondes and radar and more recently lidar to probe the atmosphere above. Both components increasingly use satellite communication to automatically despatch their data to analysis centres both in Antarctica and throughout the world. Figure 10 indicates the present (1996) network of staffed stations and those AWS which report in near real time via satellite and Figure 11 indicates the arrangements by which data from Antarctica are transmitted throughout the world via the so called Global Telecommunication System (GTS). The Antarctic networks and communications are co-ordinated, encouraged and organised (but not initiated) by the World Meteorological Organization (WMO) through its Working Group on Antarctic Meteorology and its specialist group on Antarctic Telecommunications. The decisions on the establishment of stations and deployment of equipment lies with the appropriate national agency or agencies (in Australia the Bureau of Meteorology and the Antarctic Division).
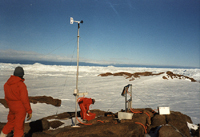
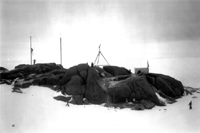
Automatic Weather Stations (AWS) have improved vastly in design and reliability in recent years. Australia was among the first to experiment with AWS in Antarctica. Between 1959 and 1961 AWS were installed at Lewis Island and Chick Island; however these experiments were ahead of their time and were in general not successful. The quite massive installation of wind generator, building and aerials at Chick Is (Figure 12) may be contrasted with a modern AWS (see eg Figure 13). Modern AWS are solar or wind powered, report directly via satellites and are now increasingly becoming a principal feature of the Antarctic observing network. In particular meteorological data are progressively being obtained from the new network of Automatic Geophysical Observatories (AGOs) which have been deployed largely by the US and UK over the otherwise vast data void area of the high Antarctic plateau. While the AGO observations are essentially designed to measure specific non meteorological geophysical data they are also being instrumented to provide the basic meteorological pressure and temperature data which are necessary for numerical weather analysis. Some Antarctic AWS provide more detailed information for research purposes in non real time (Stearns and Wendler 1988) but the intention is to have as many as possible of such research installations equipped to provide basic real time information to the GTS for day to day analysis. Surface pressure and temperature observations from the high level ice cap can be utilised in building up an assessment of the height of the standard pressure surfaces (eg 500 h Pa) using statistical techniques (Phillpot 1991).
Similarly, the drifting buoys which have been progressively deployed in the oceans since FGGE and more recently (under the International Program for Antarctic Buoys—IPAB) within the sea ice zone have the capacity to transmit basic meteorological information and sea surface temperature data as well as identify their locations. Efforts are being made to improve the coverage and Australia is contributing significantly.
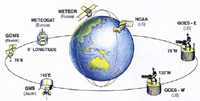
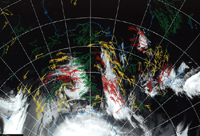
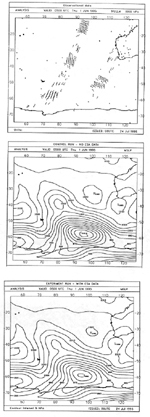
The current suite of meteorological satellites which provide data for global operations and research are shown schematically in Figure 14 though further developments include substantial improvements to the Russian satellite transmissions and the imminent dissemination in Australia of the data from the Chinese geostationary satellite Feng Yun (FY2). Most significant for polar research are the US NOAA (National Oceanic and Atmospheric Administration) polar orbiters which continue to provide high resolution imagery and vertical sounding (TOVS) (TIROS Operational Vertical Sounder) data over the polar regions. TOVS data provide measurements similar to but not as precise as those from radiosondes along the track of the satellite over cloud-free ocean surfaces. In addition, cloud drift wind vectors can be calculated (see eg Figure 15) using the data from the geostationary satellites, in particular the Japanese Geostationary Meteorological Satellite (GMS) positioned over the equator at 140°E and continuously viewing the longtitudes of the Australian region. GMS and the other geostationary satellites are not able to view very high latitudes but provide useful coverage of most of the Southern Ocean. More recently data are becoming available from the microwave scatterometer on board the European Earth Resources Satellite (ERS 1) which provide measurements of wind vectors at the sea surface. There are indications that such observations will prove useful in operational Southern Ocean analysis (Figure 16).
People in Bright Sparcs - Phillpot, Henry Robert
 |
Bureau of Meteorology |  |
© Online Edition Australian Science and Technology Heritage Centre and Bureau of Meteorology 2001
Published by Australian Science and Technology Heritage Centre, using the Web Academic Resource Publisher
http://www.austehc.unimelb.edu.au/fam/1589.html