Table of Contents
Antarctic Operational Meteorology
Abstract
Introduction
The Past
The Present
The Future
Acknowledgements
References
Index
Search
Help
Contact us

|
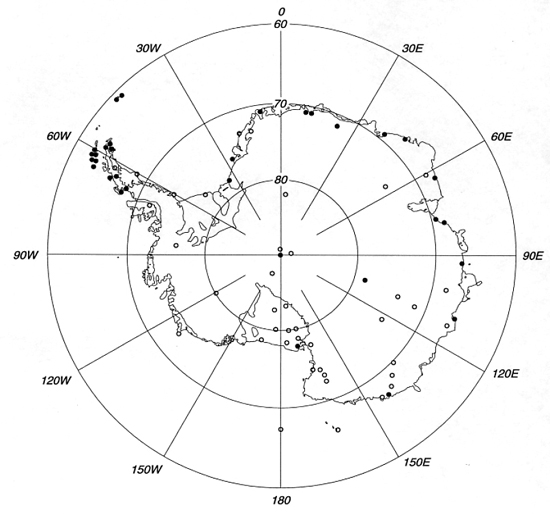
Figure 10 Antarctic surface observation network in 1996 indicating stations which report in near real time via the Global Telecommunications System (GTS) of the World Meteorological Organization (WMO). Staffed stations are shown by full circles and Automatic Weather Stations by open circles (source—WMO).
[Return to Text]
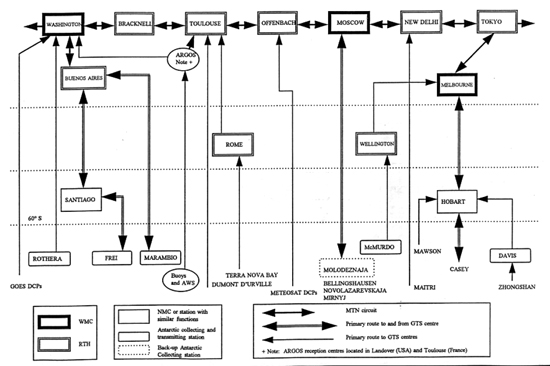
Figure 11 The routes by which Antarctic meteorological data enter the Global Telecommunication System (GTS) (source—WMO).
[Return to Text]
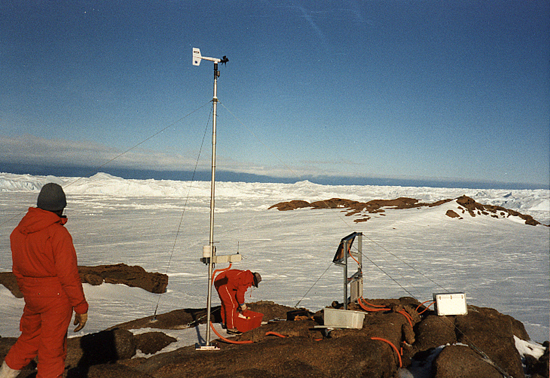
Figure 13 A typical modern Automatic Weather Station being installed at Haupt Nunataks SSW of Casey—note solar cell panel (photo—Adrian Porter, Bureau of Meteorology).
[Return to Text]
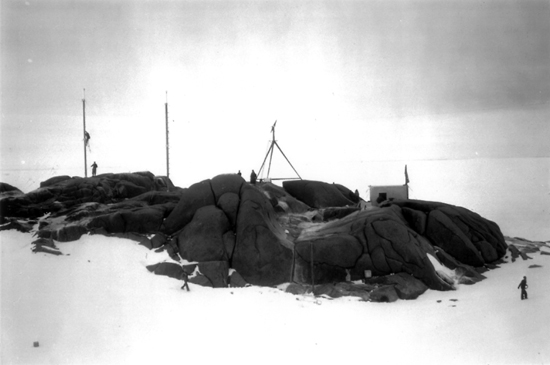
Figure 12 Installation of Chick Island Automatic Weather Station by ANARE 1961 (photo—Antarctic Division).
[Return to Text]
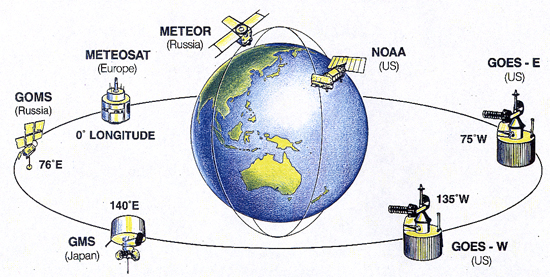
Figure 14 Space based Global Observing System of operational meteorological satellites. The longitudes of the five geostationary satellites above the equator are indicated as are the polar orbits of the US NOAA and Russian Meteor Series (source—WMO).
[Return to Text]
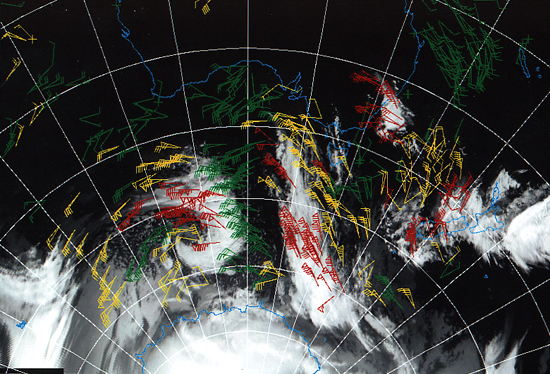
Figure 15 Upper wind vectors derived from cloud drift shown against the background of infra red imagery for the Japanese Geostationary Satellite (GMS) at 0330 UTC on 27 October 1996. Winds at 900 (green), 700 (yellow) and 400 (red) hPa are indicated. Winds are depicted as arrows flying with the wind with speeds shown in knots—triangular barb represents 50 knots full feather 10 knots, half feather 5 knots (source Steve Pendlebury—Bureau of Meteorology).
[Return to Text]
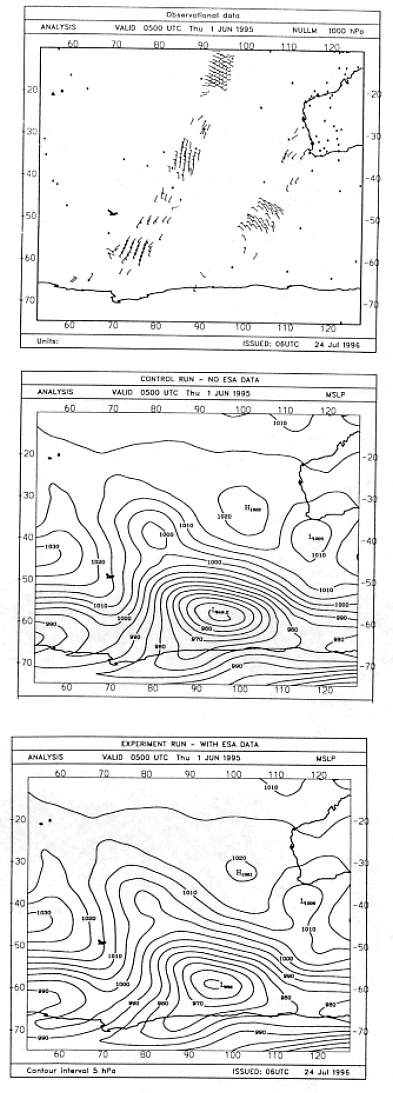
Figure 16 Microwave scatterometer data from the European Earth Resources Satellite (ERS 1) indicating wind direction at the sea surface at 05 UTC 1 January 1995 (upper panel) and the effect of its incorporation into the analysis of the Southern Ocean (middle panel—original analysis, bottom panel, with scatterometer data included). Note the more accurate specification of the deep low pressure near the Antarctic coast (source—Kieran Jacka—Bureau of Meteorology).
[Return to Text]
© Online Edition Australian Science and Technology Heritage Centre and Bureau of Meteorology 2001
Published by Australian Science and Technology Heritage Centre, using the Web Academic Resource Publisher
http://www.austehc.unimelb.edu.au/fam/1589_image.html
|


